StatPecker · 为企业提供智能洞察,为内容创作者提供惊艳视觉效果。
从提取数据趋势到可视化全球比较——StatPecker 提供快速、可信的答案,您可以发布、展示或与您的团队分享。
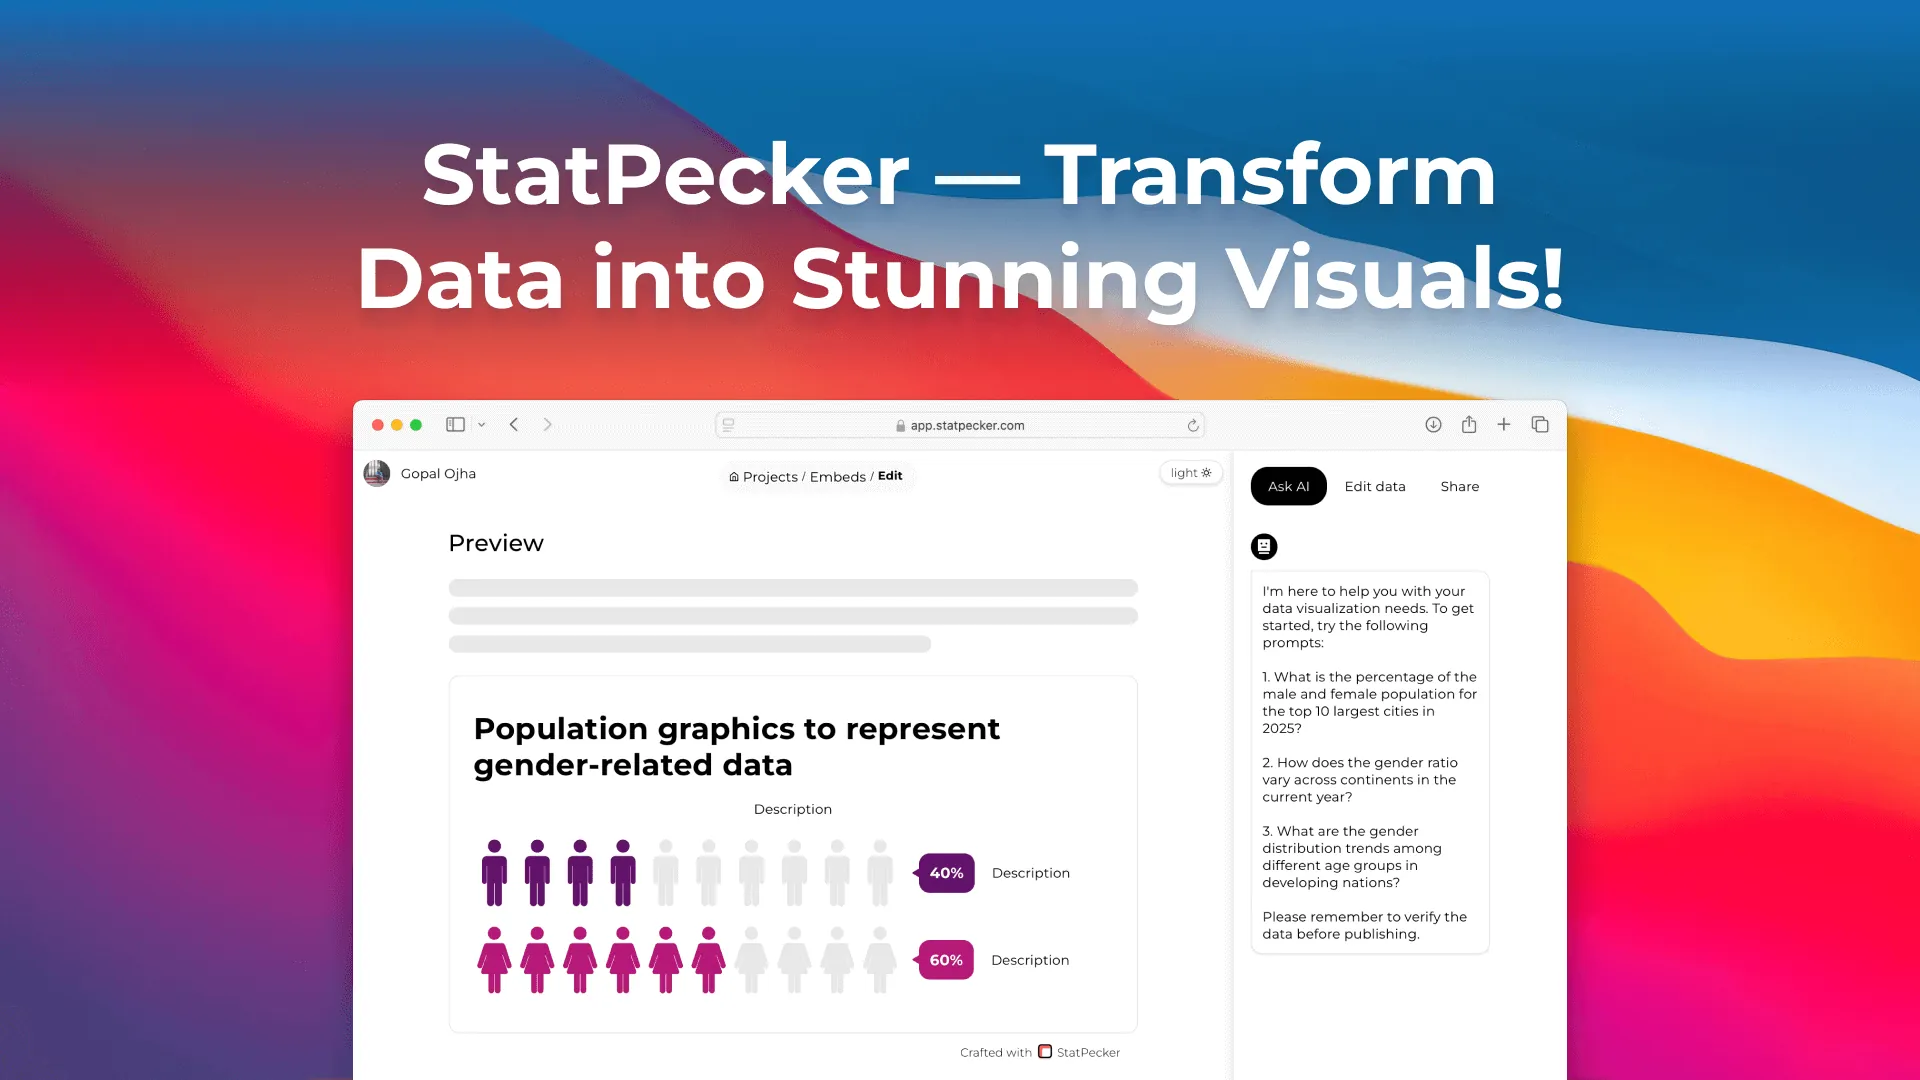
StatPecker: Transform Data into Compelling Visual Stories with AI
In today's data-driven world, the ability to extract meaningful insights and present them in visually compelling ways is more important than ever. Whether you're a business analyst trying to make sense of complex trends, a content creator seeking to engage your audience with stunning visuals, or a team lead looking to communicate findings effectively, the challenge remains the same: raw data alone doesn't tell a story. This is where StatPecker comes in – an innovative AI-powered platform that bridges the gap between raw data and compelling visual narratives.
What Makes StatPecker Stand Out?
At its core, StatPecker is designed to make data analysis and visualization accessible to everyone, not just data scientists. The platform leverages artificial intelligence to help users ask questions and receive instant, validated insights without needing to master complex analytical tools. With over 1,361 users and more than 1,400 infographics created, it's clear that StatPecker has struck a chord with professionals who need quick, reliable, and visually appealing data stories.
Key Features and Capabilities
1. Natural Language Query System
The standout feature of StatPecker is its natural language query capability. Instead of wrestling with complicated query languages or spreadsheet functions, you can simply ask questions in plain English. The AI engine processes your request and retrieves insights from validated sources, making data analysis as easy as having a conversation.
2. Interactive Publishing and Embedding
StatPecker doesn't just create static images – it generates interactive visualizations that you can seamlessly embed into blogs, articles, and websites. This interactivity allows audiences to explore data at their own pace, engaging them more deeply with the content and enhancing comprehension.
3. CSV Analysis Made Simple
For those working with local data files, StatPecker offers a powerful CSV upload feature. Simply upload your CSV file, and the platform automatically extracts key insights and patterns. This eliminates hours of manual spreadsheet work and reduces the risk of human error in data interpretation.
4. Versatile Export Options
Once you've created your visualizations, StatPecker allows you to download them as images for use in reports, presentations, or any other medium. This flexibility ensures that your data stories can reach audiences wherever they are, regardless of the platform or format constraints.
Real-World Use Cases and Benefits
For Business Analysts and Decision Makers
Business professionals can use StatPecker to quickly analyze market trends, compare performance metrics, and identify patterns that inform strategic decisions. The ability to ask natural language questions means that even team members without technical backgrounds can contribute to data-driven discussions, fostering a more collaborative analytical culture.
For Content Creators and Marketers
Content creators can leverage StatPecker to transform dry statistics into eye-catching infographics that capture audience attention. Whether you're writing a blog post about global economic trends or creating social media content comparing product features, StatPecker helps you present complex information in ways that are both accurate and visually compelling.
For Researchers and Academics
Researchers can use the platform to visualize comparative studies, highlight key findings, and create engaging presentations for conferences or publications. The ability to embed interactive visualizations directly into online articles enhances reader engagement and understanding.
For Small Business Owners
Small business owners without dedicated data teams can gain valuable insights into their operations by uploading CSV files containing sales data, customer information, or inventory records. This democratization of data analytics helps level the playing field between small businesses and larger enterprises with dedicated analytics departments.
How StatPecker Compares to Similar Tools
Traditional data visualization tools like Tableau, Power BI, or even basic spreadsheet software require significant technical expertise and time investment. Learning SQL, mastering complex visualization libraries, or manually crafting charts can create barriers to entry for many professionals. StatPecker takes a fundamentally different approach by prioritizing accessibility and speed.
While other AI analytics tools focus primarily on automated reporting or dashboard creation, StatPecker emphasizes the storytelling aspect of data visualization. It doesn't just present numbers – it helps you craft narratives that resonate with your audience. The platform's focus on interactive, embeddable visualizations also sets it apart from tools that primarily generate static images or PDF reports.
Perhaps most importantly, StatPecker's pricing model is refreshingly simple. Instead of expensive monthly subscriptions that quickly add up, users can start with a generous free tier or opt for a one-time lifetime access fee of $150 (often available at a discount). This approach makes professional-grade data visualization accessible to individuals and small teams who might otherwise be priced out of enterprise solutions.
Conclusion: Should You Use StatPecker?
StatPecker represents a significant step forward in making data analytics and visualization accessible to everyone. Its combination of AI-powered natural language processing, interactive visualizations, and user-friendly design creates a powerful tool that can benefit professionals across virtually any industry.
If you find yourself regularly needing to analyze data, create visualizations, or tell stories with statistics, StatPecker is worth exploring. The free tier allows you to test the platform's capabilities with 10 AI queries and 10 CSV uploads, giving you a risk-free opportunity to see if it fits your workflow.
For content creators looking to elevate their visual storytelling, business professionals seeking to improve their analytical communication, or anyone who wants to transform raw data into compelling narratives, StatPecker offers a unique solution that balances power with accessibility. In a world where data is increasingly valuable but often overwhelming, StatPecker helps you turn information into insight and insight into action.
The platform is particularly well-suited for those who value speed and ease of use without sacrificing quality or accuracy. By eliminating the technical barriers to data analysis and visualization, StatPecker empowers users to focus on what matters most: deriving meaning from data and communicating that meaning effectively to others.
Whether you're analyzing global trends for a research paper, creating social media content comparing industry statistics, or simply trying to understand patterns in your business data, StatPecker provides the tools you need to transform complex information into clear, compelling, and actionable visual stories.
The future of data analytics isn't just about having access to more information – it's about being able to understand, communicate, and act on that information efficiently. StatPecker is helping to shape that future, one visualization at a time.